Apollo stands as a key financing partner for some of the most innovative sectors driving our future.
Subscription businesses rely in part on consumer inertia. In Selling Subscriptions, Einav, Klopack and Mahoney (2025) find that cancellation frictions roughly double sellers' revenues on average. Muse, an AI agent that can identify and cancel unwanted subscriptions on a consumer's behalf, could weaken those economics by making it easier to break the cycle of unwanted renewals — a concern reflected in last week's selloff in subscription-related stocks. But lost subscription revenue is not necessarily lost consumption: these categories represent a small share of spending (see chart below), and consumers are more likely to redirect any savings than put them aside. The bottom line is that Muse is more likely to change where consumers spend than derail overall consumption.
Written by Allison Boxer
As of July 2026. *Home and auto insurance is net of normal claims. Sources: BEA, Apollo Thematic Investing
See important disclaimers at the bottom of the page.
Wall Street equity analysts work in sector silos, and when you add up their forecasts, the numbers are internally inconsistent.
The analysts covering tech expect the sector's operating cash flow to more than double to roughly $2.4 trillion by 2028, an increase of over $1.2 trillion, see chart below. Meanwhile, the analysts covering the other sectors in the S&P 500, which are tech's customers, expect those companies to add much less operating cash flow.
In other words, the tech silo is betting on a future in which demand for AI and tech services explodes, while the silos covering the companies that would pay for those services see a much more modest outlook. Both cannot be right at the same time.
The bottom line is that either tech's customers will generate a lot more cash than their analysts expect, or tech's cash flow forecasts are too optimistic, which raises the question of who exactly will be writing all those checks to buy AI services.
Note: Technology includes Information Technology and Telecommunications. Sources: FactSet, Apollo Chief Economist
See important disclaimers at the bottom of the page.
Fed press conferences began in 2011, and the chart below plots the total number of questions asked against the median words per answer for every one of them.
At his June and July press conferences, Fed Chair Kevin Warsh followed the same pattern as previous Fed chairs, but in September, he took fewer questions and gave shorter, more focused answers, letting the rate hike speak more for itself.
The bottom line is that Warsh is showing markets that the Fed can communicate clearly and concisely, with less noise and more signal.
Note: 95 briefings, April 27, 2011 (the first regular post-FOMC press conference) through September 16, 2026, roughly quarterly, at September meetings only, through 2018, then after every meeting from January 2019. A question is a journalist's utterance of five or more words or one containing a question mark; call-ons by Fed press-office moderators are not counted. Median words per answer covers the chair's replies, excluding the opening statement. Sources: Federal Reserve post-FOMC press conference transcripts, Apollo Chief Economist
See important disclaimers at the bottom of the page.
Muse and similar agentic AI assistants could soon sweep household cash automatically into accounts paying 3.3% to 5.0%, instead of the 0.1% national average on checking accounts.
If every household used AI agents to optimize the return on their cash balances, banks could lose a large share of the cheap deposits they rely on to make loans, which would be a problem for the entire financial system.
Sources: Revolut, Varo Bank, Adelfi, Pibank, Sofi, FitnessBank, AlumniFi, LendingClub, Current, Wealthfront, FDIC, Haver Analytics, Apollo Chief Economist
See important disclaimers at the bottom of the page.
September 26, 2026
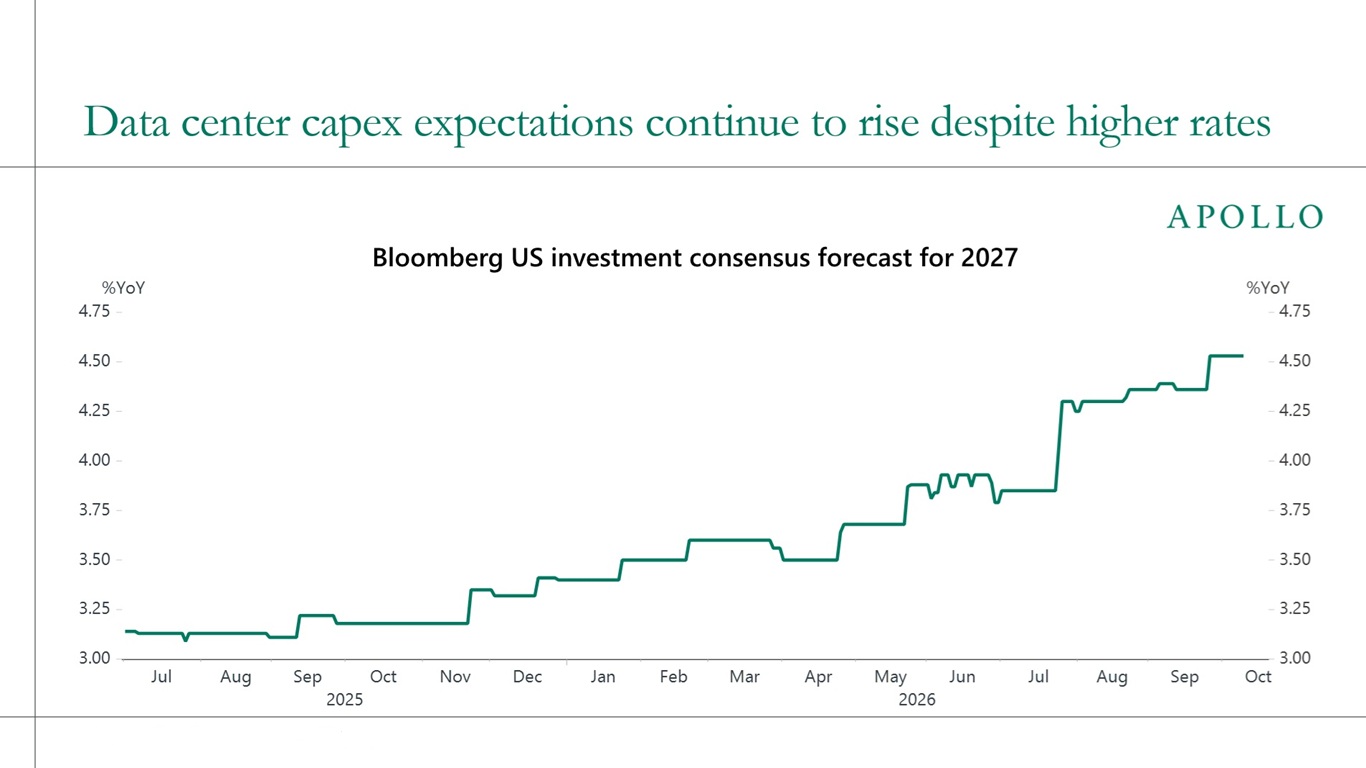
Rates are rising for reasons beyond a strong economy, with sticky inflation lifting yields in the front end, record hyperscaler debt issuance pressuring the belly and fiscal worries pushing up the long end.
For credit, yields are well above their 10-year averages, with IG paying almost 6% and leveraged loans nearly 10%, but with spreads near all-time tights and stocks and bonds moving together, investors can no longer count on bonds to hedge their equity risk.
For more, see this new chart book by my colleague Shobhit Gupta and me.
Source: Apollo Chief Economist
See important disclaimers at the bottom of the page.
Higher for longer is a slow squeeze for low-quality credit. Every month rates stay elevated, more CCC borrowers from the 2021–22 vintages hit the refinancing wall with less cash to service their debt, and with CCC yields around 15% while the broader credit market stays calm, the bill from the cheap-money era is landing on the weakest balance sheets first.
The pain is sharpest in heavily levered, PE-backed technology, healthcare and consumer discretionary names, where floating-rate debt, thin margins and AI disruption risk leave little room to absorb years of elevated borrowing costs.
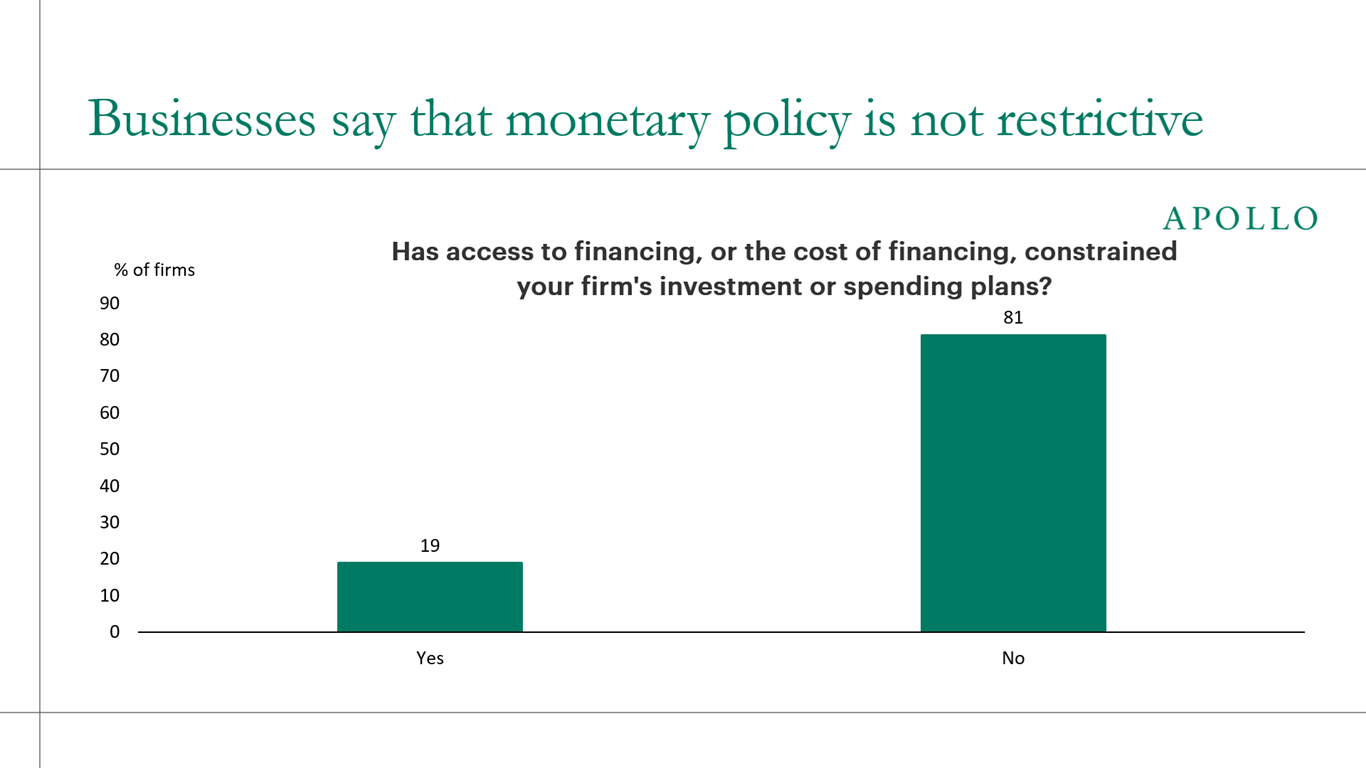
The bottom line is that monetary policy is working with a lag and working unevenly. Strong balance sheets locked in cheap fixed-rate debt and have barely felt the Fed's tightening, while the most leveraged borrowers feel it in full as floating-rate costs and maturities reset, so the transmission mechanism is running mainly through the bottom of the credit stack.
For investors, the message is to move up in quality, because high-quality credit still offers attractive all-in yields without the default, restructuring and liability-management risk that is now concentrated in lower-rated credits.
In short, it is a good idea to invest in companies with earnings because they can pay their higher debt-servicing costs.
Sources: Bloomberg, Macrobond, Apollo Chief Economist
See important disclaimers at the bottom of the page.
September 24, 2026
Roughly 10% of software-spending businesses on Ramp now pay a GPU vendor, up from under 4% two years ago, see chart below. Nearly all of that came from model serving and inference, which went from 2.4% to 8.7% of firms, while neoclouds crept from 2.0% to 3.3%, and wholesale GPU capacity never left the floor at 0.1%.
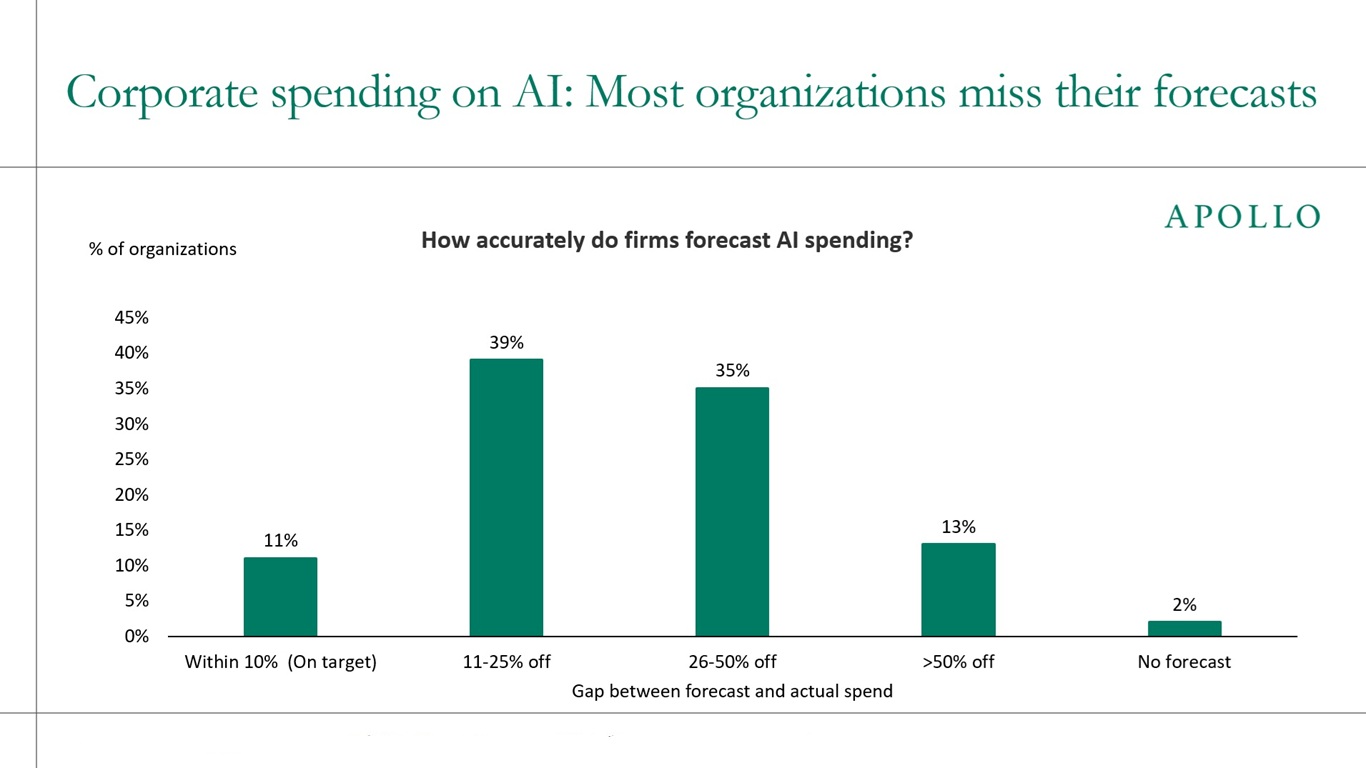
That gap describes what most companies are actually doing with AI. Businesses are adding a model to an existing product or workflow, paying per call, and treating it as another software subscription they can cancel next month. Very few are building anything that requires owning or reserving the hardware underneath.
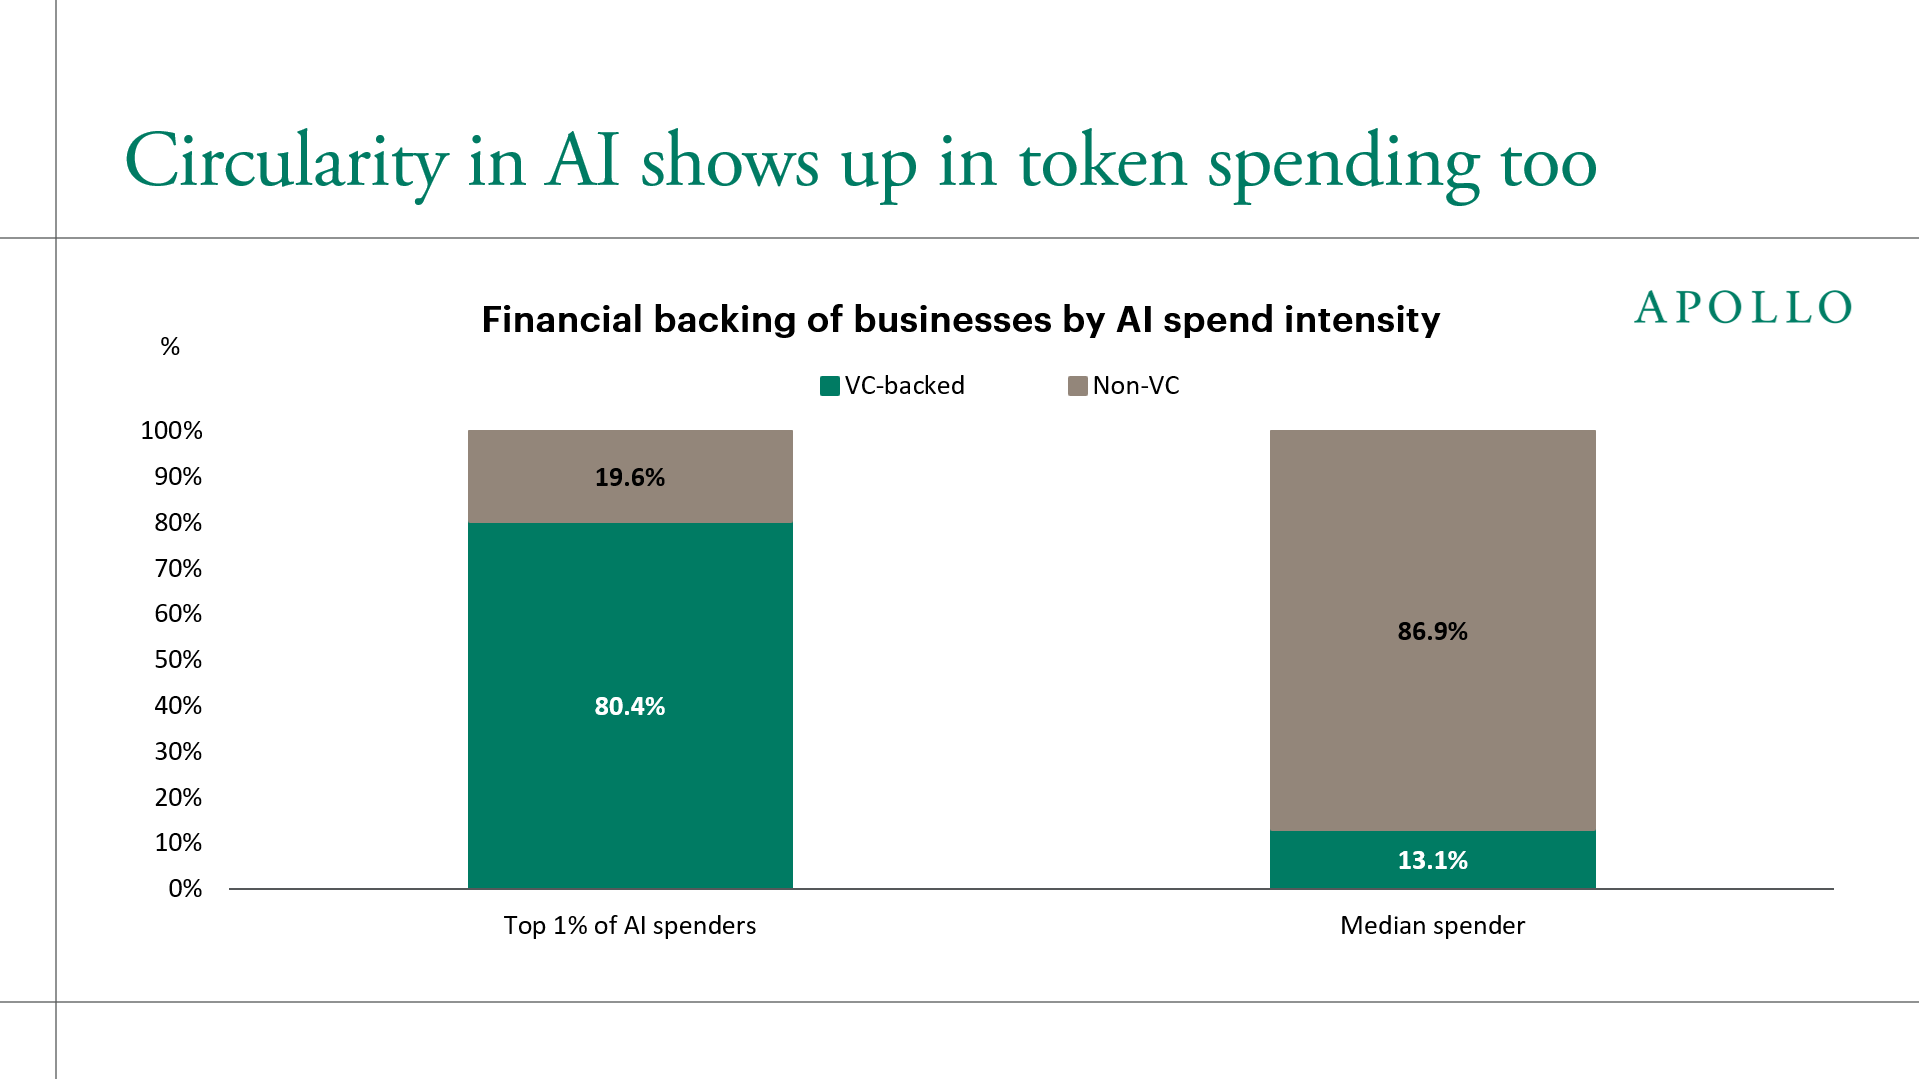
The table below shows how unevenly the dollars land. The top 10% of customers account for 99.5% of model-serving spend and 99% of neocloud spend, leaving the bottom 90% of firms with 0.5% and 1%.
For comparison, non-AI SaaS is at 91.8% and CRM at 84.2%, where the long tail still contributes a real 15.8%, because a small company buying a CRM buys something close to what a large one buys. AI spending tracks how much you run, not how many people you have, which is why a small number of firms in production dwarf everyone else.
The bottom line is that adoption is broadening while the spending base is not, and AI infrastructure will keep depending on a small set of heavy spenders until the tail scales up.
Sources: Ramp Chief Economist Ara Kharazian, Apollo Chief Economist
See important disclaimers at the bottom of the page.
The US Gulf Coast diesel crack spread cleared $100/bbl for the first time on record in August against a normal range of $15 to $30. Unlike a gasoline spike, which lands on consumers as a one-time tax on discretionary spending, diesel is an intermediate input embedded in the delivered cost of nearly every physical good, from freight and rail to agriculture and construction.
That means the rise in diesel prices does not stay in the energy line of the CPI but migrates with a lag into core goods and services, which is exactly the kind of pass-through the Fed cannot dismiss as transitory.
The bottom line is that diesel margins are now setting the long end of the curve because diesel crack spreads are an important driver of future core inflation.
Note: FUCLM1 Index: US Gulf Coast ULSD–WTI crack spread, front-month futures ($/bbl, lhs). USGG10YR Index: US Generic Government 10-Year Treasury yield (%, rhs). Sources: Bloomberg, Apollo Chief Economist
See important disclaimers at the bottom of the page.
After a decade of reaching for yield in a zero-rate world, investors no longer have to take outsized risk to generate income. Even if yields rise further from here, current levels in high-quality fixed income are already attractive, both for households and for investors with long-duration liabilities.
Sources: Bloomberg, ICE BofA, Crane Data, PitchBook, Apollo Chief Economist
See important disclaimers at the bottom of the page.
September 21, 2026
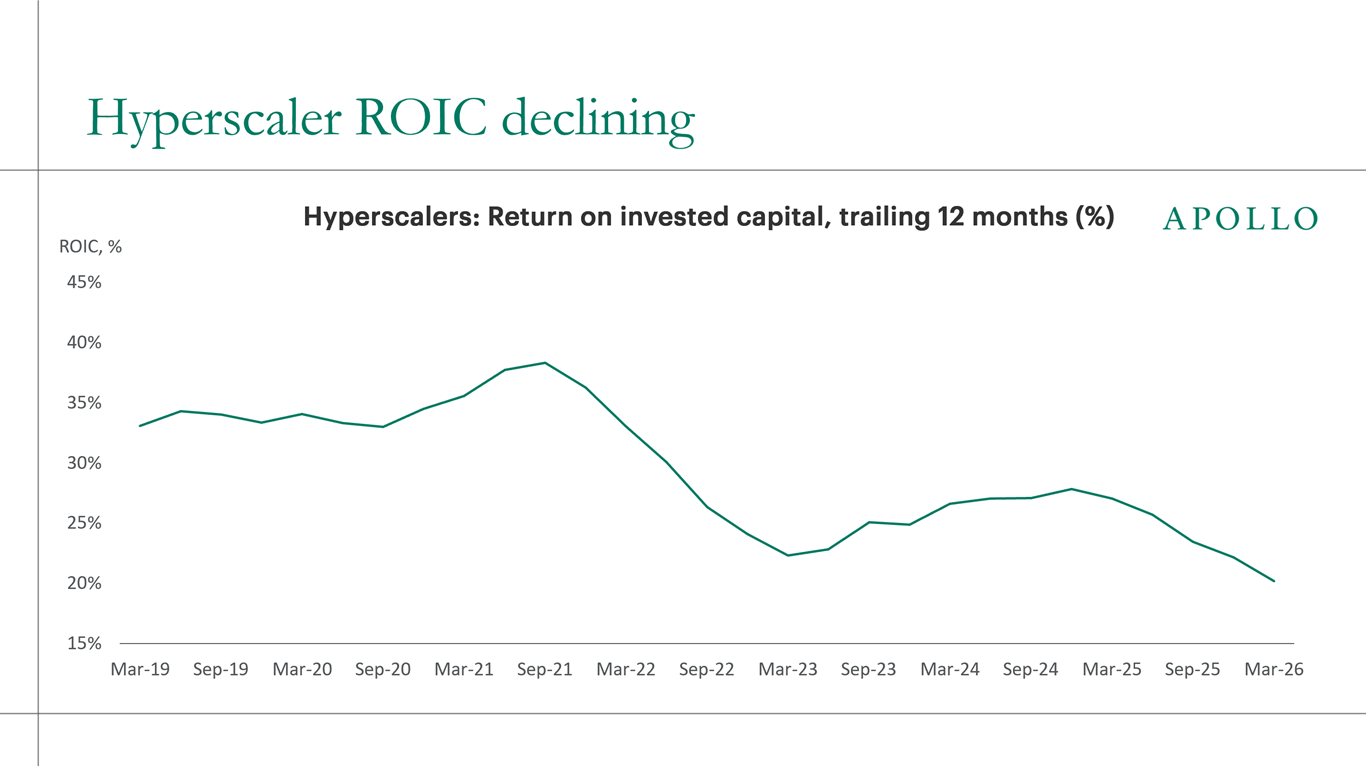
The credit story in hyperscalers rests on a single consensus assumption, that operating cash flow triples from $600 billion to $2 trillion, see chart below.
If this doesn't happen, then the risk is that the AI trade weakens, with credit spreads widening, capex plans getting cut and ultimately US GDP growth slowing.
Note: Hyperscalers are: Google, Meta, Amazon, Microsoft and Oracle. Sources: FactSet, Apollo Chief Economist
See important disclaimers at the bottom of the page.