Illustration of a glowing light bulb with a stylized capital “A” filament centered inside, symbolizing ideas, innovation, and insight against a green circular background.

The Daily Spark

Stay ahead of the markets with The Daily Spark at Apollo. Get exclusive, daily data-driven analysis on the US economy, inflation, and capital markets from Apollo Chief Economist Torsten Slok.
Subscribe About the Author

Not subscribed yet? Get the Daily Spark delivered to your inbox.

Subscribe
Filters
Topics
1-10 of 567 Results
Global & Geopolitical Developments

July 22, 2026

The Chokepoint Risk

Share

Tanker crossings through the Strait of Hormuz have declined again, and refining crack spreads are widening sharply as constrained crude oil supplies prevent refineries from boosting throughput to meet steady demand for gasoline and diesel.

The real tail risk emerges if inventories at critical nodes like airports or power plants suddenly run dry, triggering non-linear cascading damage.

Edward Fishman's Chokepoints thesis explains the dynamic: geopolitical leverage concentrates not in reserves, but in the narrow passages through which the world's oil actually flows.

Our chart book, available here, does a deeper dive into energy demand and supply dynamics around the Strait of Hormuz.

Download high-res chart book

See important disclaimers at the bottom of the page.

Macroeconomic Indicators & Trends

July 21, 2026

Next Week Could Be Volatile for Markets

Share

Three events converge next week that could dramatically reshape market narratives:

1) Hyperscaler earnings (July 29-30)

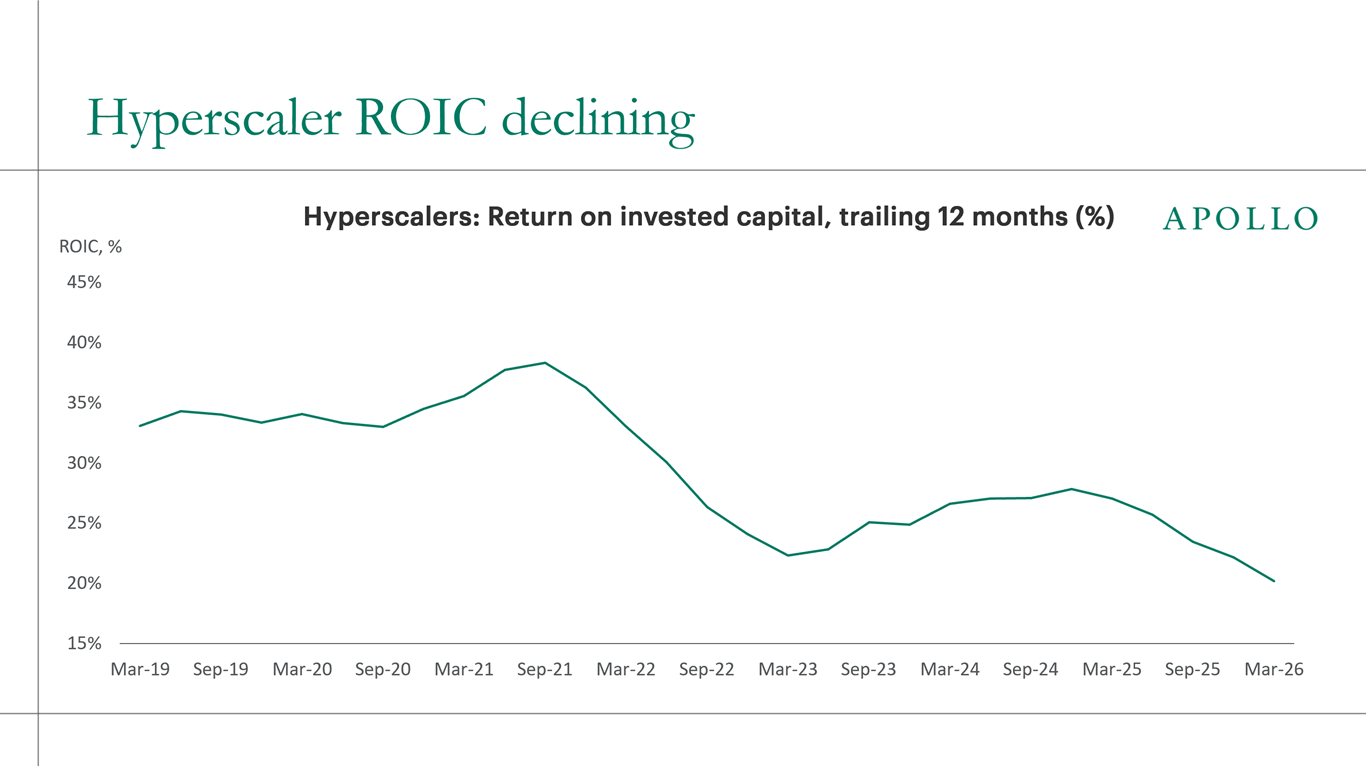
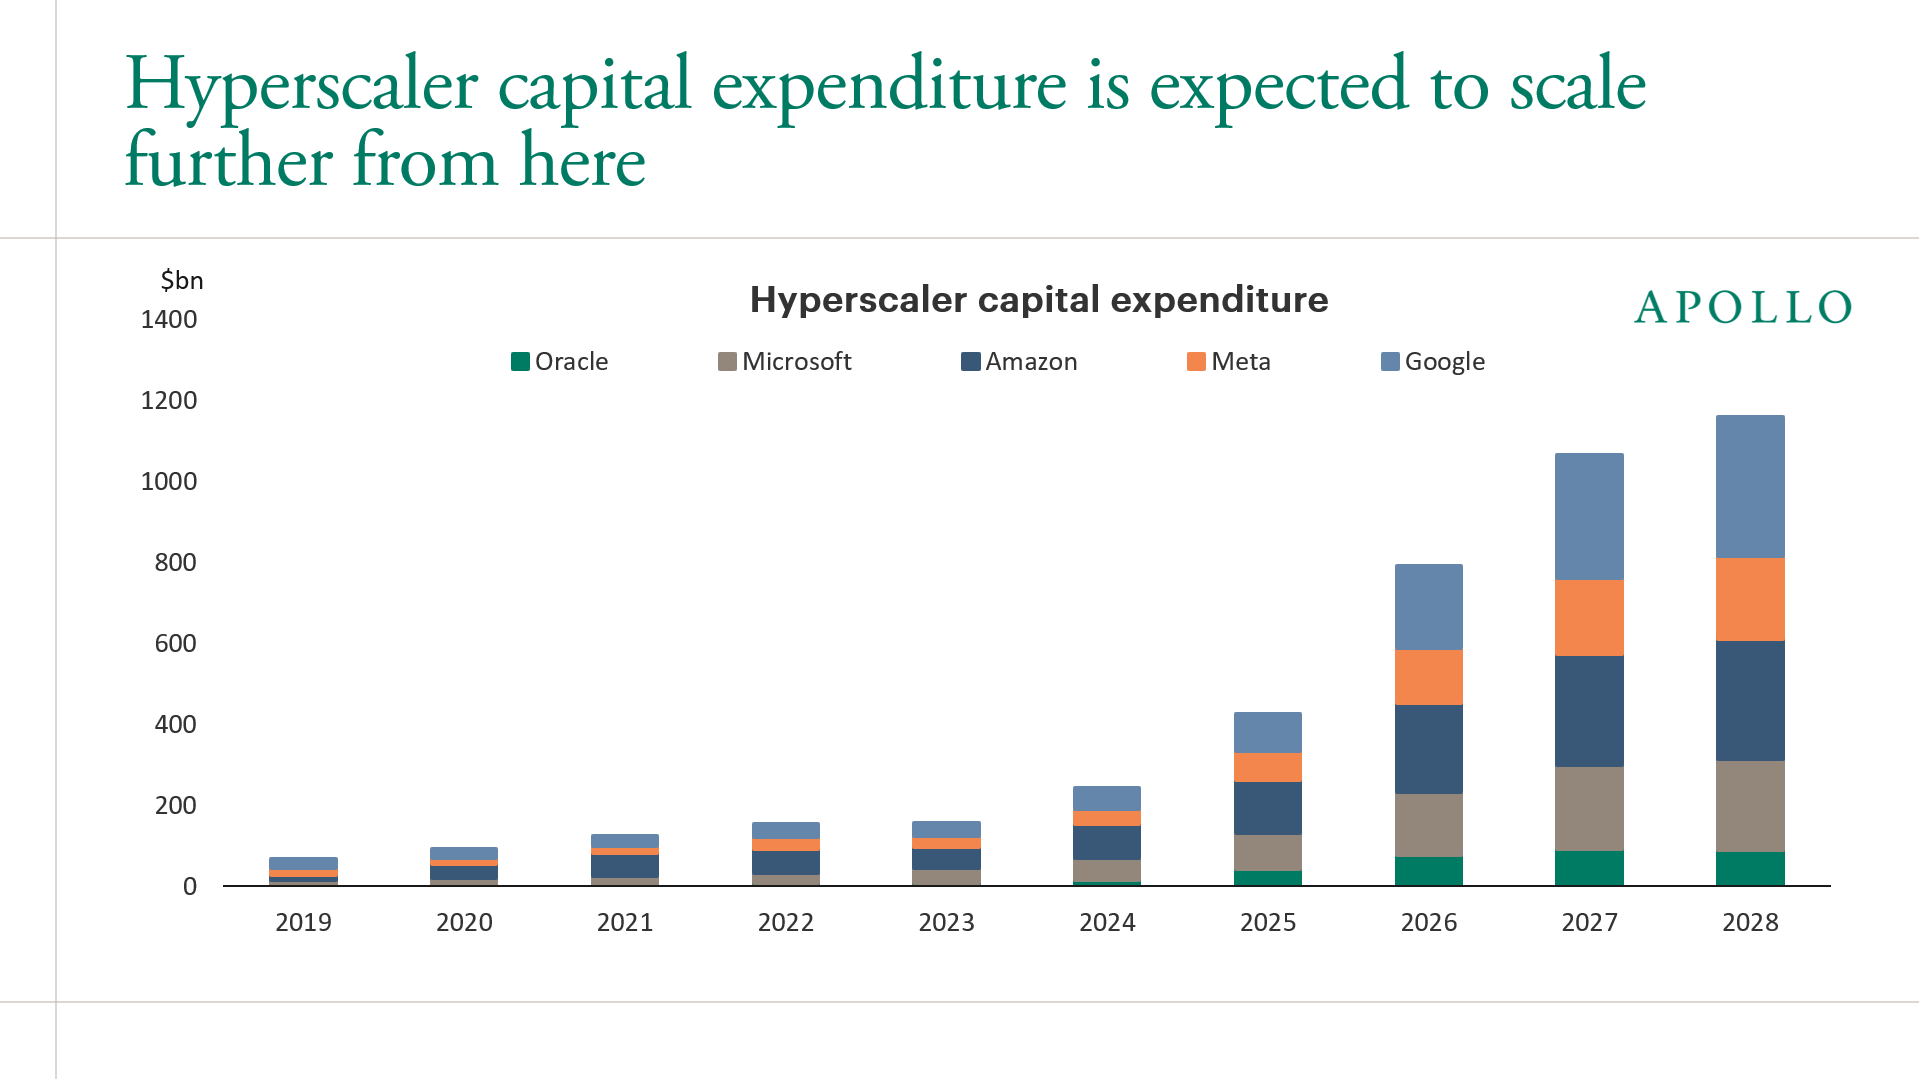
Microsoft, Meta and Amazon report back-to-back, and investors are watching the AI trade obsessively. Are capex investments, earnings growth and returns accelerating or stalling?

2) Fed meeting (July 28-29)

Nine of 18 Fed officials project a rate hike this year. Forward guidance has been eliminated, making individual Fed speakers the only remaining signal of intent. Recent Fedspeak has been unambiguously hawkish on inflation. With no roadmap, markets will parse every word for clues about the path ahead.

3) Iran conflict re-escalating

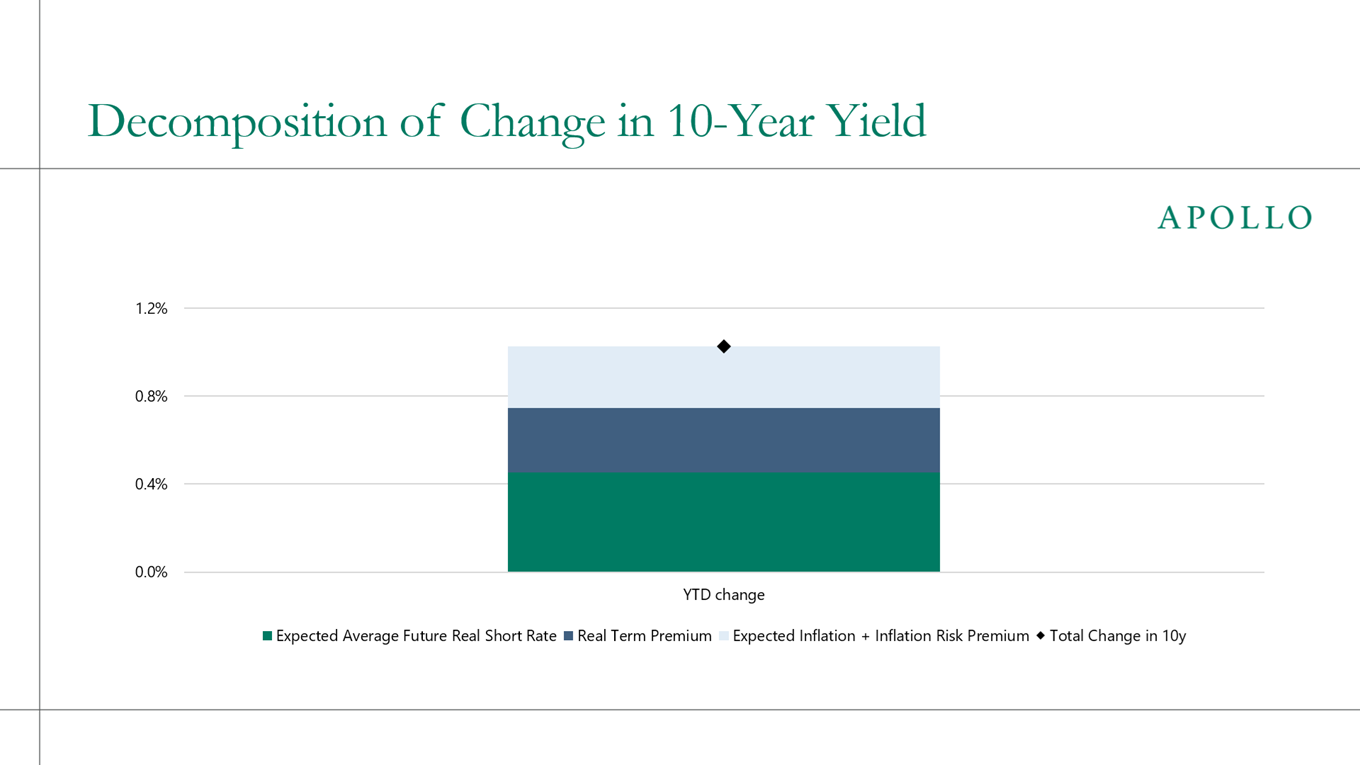
The Strait of Hormuz is a critical chokepoint. Escalation could constrict oil flows, deplete global reserves, and spike energy prices, adding fuel to the inflation battle the Fed is waging and putting further upward pressure on yields.

Bottom line: Next week answers three separate questions: Are AI capex investments panning out? Can the Fed contain inflation? Will geopolitics stay manageable? Markets are currently betting yes on all three.

Download high-res chart

See important disclaimers at the bottom of the page.

Financial Markets & Risk Dynamics

July 20, 2026

Strong Demand for Credit Coming From Record-High Annuity Sales

Share

Since the Fed raised interest rates in 2022, annuity sales have basically doubled and stayed at that higher level. In turn, these strong sales are creating strong institutional demand for both public and private credit, see chart below.

Download high-res chart

See important disclaimers at the bottom of the page.

Macroeconomic Indicators & Trends

July 19, 2026

NYC Subway Ridership Has Recovered on Weekends but Not on Weekdays

Share

Six years after the pandemic, weekend subway ridership in New York has recovered to nearly 90% of its 2019 level while weekdays remain stuck near 75%, consistent with Nick Bloom's finding that the shift to hybrid work has permanently thinned the weekday commute, see chart below and here.

Download high-res chart

See important disclaimers at the bottom of the page.

Monetary & Fiscal Policy

July 18, 2026

Tariffs 6 7

Share

The effective tariff rate has declined from 11% at the peak to between 6% and 7% today, see chart below.

Download high-res chart

See important disclaimers at the bottom of the page.

Macroeconomic Indicators & Trends

July 17, 2026

The Labor Market Explains Why Inflation Won’t Go Away

Share

With the Fed estimating the non-accelerating inflation rate of unemployment (NAIRU) at below 4.5%, and unemployment having stayed at or below that level for 57 months, tied for the longest such streak on record, the labor market has been operating in excess-demand territory for an unusually long time. That persistent tightness is a key reason inflation has remained elevated: when unemployment runs below NAIRU, wages and prices face sustained upward pressure.

The chart below puts this streak in historical context. Prior episodes of sub-4.5% unemployment were typically far shorter. The current one is one of the longest on record, which helps explain why the ongoing inflation overshoot since 2021 has been so stubborn.

The bottom line is that a strong economy is the reason why inflation has been high, and only by keeping rates higher for longer can the Fed cool inflation down towards the FOMC’s 2% inflation target.

Download high-res chart

See important disclaimers at the bottom of the page.

Macroeconomic Indicators & Trends

July 16, 2026

Chinese Models vs. Frontier Models

Share

The Epoch Capabilities Index combines scores from many different AI benchmarks into a single "general capability" scale, and the chart below shows that open-weight models trail the closed-weight frontier by around four months. For more, see also here.

Download high-res chart

See important disclaimers at the bottom of the page.

Financial Markets & Risk Dynamics

July 15, 2026

Cover Ratios for Hyperscaler Bonds Declining

Share

The cover ratio measures how many dollars of investor orders a bond deal receives for every dollar of bonds issued. For hyperscalers, it has fallen from nearly 5x in February 2026 to below 2x in July, suggesting investors may need wider spreads to absorb additional hyperscaler supply, see chart below. For more discussion, see also here.

Download high-res chart

See important disclaimers at the bottom of the page.

Macroeconomic Indicators & Trends

July 14, 2026

How Exposed Is Your Job to AI? The Experts Can’t Agree

Share

To gauge how much AI affects a job, researchers rate it from 0 to 1 based on how many of its tasks could be, or already are, done with AI. The closer to 1, the more exposed the job.

The trouble is that the studies doing this quantification agree for low-exposure jobs like hairdressers and dancers. But for the high-exposure jobs everyone actually worries about, like tax preparers, telemarketers and mathematicians, they disagree wildly, see chart below.

So the jobs most likely to be called "at risk" are the ones we understand least. These roles tend to involve many different tasks, and while AI can do some, others are hard to automate, which is exactly why the measures disagree.

The Yale Budget Lab came to a similar conclusion here, and my colleague Sania Edlich and I will keep digging into this in upcoming Sparks. For more, see also here.

Download high-res chart

See important disclaimers at the bottom of the page.

Financial Markets & Risk Dynamics

July 13, 2026

The Dollar’s Hidden Dependence on the AI Trade

Share

Net foreign inflows into US equities have surged to a record high, driven in large part by overseas investors seeking AI exposure they cannot get in their home markets, see chart below.

With most foreign equity investors not hedging their FX risk, the bottom line is that if AI disappoints, the resulting pullback in these inflows would be a significant downside risk to the US dollar.

Download high-res chart

See important disclaimers at the bottom of the page.

This presentation may not be distributed, transmitted or otherwise communicated to others in whole or in part without the express consent of Apollo Global Management, Inc. (together with its subsidiaries, “Apollo”).

Apollo makes no representation or warranty, expressed or implied, with respect to the accuracy, reasonableness, or completeness of any of the statements made during this presentation, including, but not limited to, statements obtained from third parties. Opinions, estimates and projections constitute the current judgment of the speaker as of the date indicated. They do not necessarily reflect the views and opinions of Apollo and are subject to change at any time without notice. Apollo does not have any responsibility to update this presentation to account for such changes. There can be no assurance that any trends discussed during this presentation will continue.

Statements made throughout this presentation are not intended to provide, and should not be relied upon for, accounting, legal or tax advice and do not constitute an investment recommendation or investment advice. Investors should make an independent investigation of the information discussed during this presentation, including consulting their tax, legal, accounting or other advisors about such information. Apollo does not act for you and is not responsible for providing you with the protections afforded to its clients. This presentation does not constitute an offer to sell, or the solicitation of an offer to buy, any security, product or service, including interest in any investment product or fund or account managed or advised by Apollo.

Certain statements made throughout this presentation may be “forward-looking” in nature. Due to various risks and uncertainties, actual events or results may differ materially from those reflected or contemplated in such forward-looking information. As such, undue reliance should not be placed on such statements. Forward-looking statements may be identified by the use of terminology including, but not limited to, “may”, “will”, “should”, “expect”, “anticipate”, “target”, “project”, “estimate”, “intend”, “continue” or “believe” or the negatives thereof or other variations thereon or comparable terminology.